What Happens to Your Paycheck When the Strait of Hormuz Shuts Down? — The Economics of the 2026 Middle East Crisis
How a 21-mile waterway thousands of miles away quietly raises your grocery bill, freezes your mortgage rate, and reshapes global markets — and what you can do about it.
The Most Expensive Weapon in the World Is Fear
The most expensive weapon in the world isn’t a nuclear warhead or a stealth bomber. It’s fear.
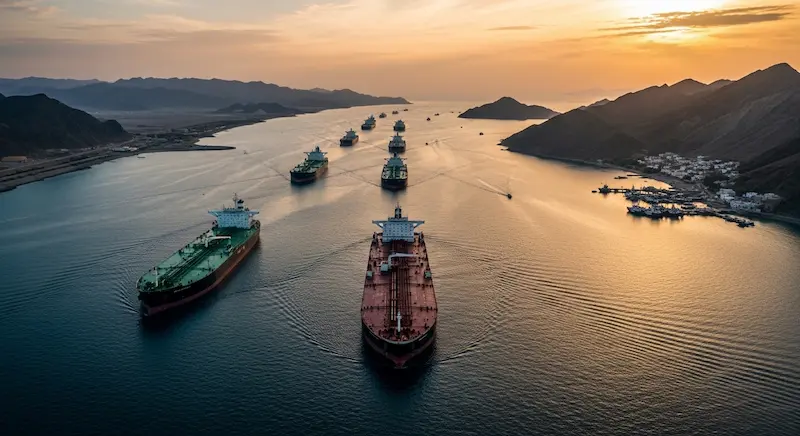
As of March 2026, the global economy is staring down the barrel of that weapon once again. On February 28, the United States and Israel launched a massive wave of airstrikes against Iran, killing Supreme Leader Ayatollah Ali Khamenei and other top officials. Iran’s Revolutionary Guard Corps responded by broadcasting warnings to commercial vessels that “no ship is allowed to pass the Strait of Hormuz.” Within hours, tanker traffic through the strait dropped by roughly 75%.
When futures markets opened Sunday evening, Brent crude briefly surged to $82.37 per barrel — its highest level since January 2025 — while WTI crude jumped more than 8%. Barclays warned that oil could hit $100 per barrel; UBS analysts said a material disruption could send Brent above $120.
But the real story isn’t the missiles. It’s the structural shift happening beneath the headlines. For professionals and investors, the question isn’t “what’s happening in the Middle East?” — it’s “how does this invisible machinery transfer costs from that conflict directly into my wallet?” This guide breaks down that machinery, piece by piece.
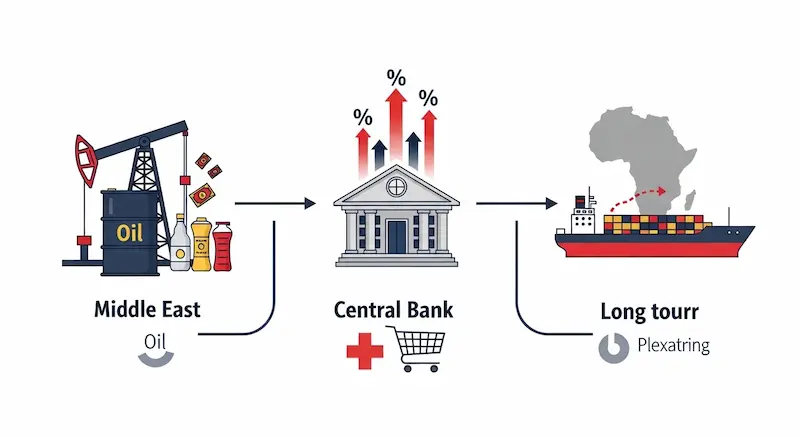
The “Invisible Tax” on Your Wallet — Three Channels That Transfer War Costs to You
Why does a conflict thousands of miles away dictate the price of your groceries or the interest rate on your mortgage? The answer lies in the concept of the Invisible Tax — the hidden cost increase that reaches consumers through three distinct channels whenever Middle East tensions flare.
Channel 1: The Energy Multiplier — Oil Is the Invisible Ingredient
Oil is the invisible ingredient in nearly every consumer good you buy. When crude prices rise, manufacturing costs go up, and so does the cost of last-mile delivery to your doorstep.
Right now, WTI crude is hovering around $72 per barrel — up roughly 17% since the start of the year, even before this weekend’s escalation. Retail gasoline prices move approximately 2.5 cents per gallon for every $1 increase in crude, so consumers could see a 10-cent-per-gallon hike starting as soon as Monday, according to GasBuddy analyst Patrick De Haan.
And it’s not just gasoline. Qatar, the world’s second-largest LNG exporter behind the United States, ships virtually all of its liquefied natural gas through the Strait of Hormuz. Disruptions there could spike energy prices across Europe as well.
Channel 2: Monetary Policy Gridlock — Why Rate Cuts Keep Getting Delayed
Central banks use interest rates as their primary tool against inflation. When energy-driven inflation spikes, the Federal Reserve is forced to keep rates higher for longer — and that affects everything from your mortgage to your car loan.
Here’s where things stand right now. The annual U.S. inflation rate fell to 2.4% in January 2026, down from 2.7% in December, according to the Bureau of Labor Statistics. That’s encouraging, but it’s still above the Fed’s 2% target. The Federal Reserve held its benchmark rate steady at 3.5%–3.75% at the January FOMC meeting — the first pause after three consecutive rate cuts in late 2025. J.P. Morgan notes that markets see low odds of a cut at the March meeting.
The January FOMC minutes reveal the tension clearly: a “vast majority” of participants judged that the risk of persistent inflation still outweighs downside risks to employment. Fed Governor Stephen Miran dissented, arguing rates may already be too tight, but the committee chose to wait. Geopolitical energy costs are a key reason why.
The practical impact? If you were hoping for lower mortgage rates or cheaper borrowing this spring, the Strait of Hormuz may have other plans.
Channel 3: The Cape of Good Hope Premium — The Long Way Around
When the Red Sea or the Persian Gulf becomes too dangerous for commercial shipping, vessels reroute around the southern tip of Africa via the Cape of Good Hope. This detour adds approximately 3,500 nautical miles and 10 to 14 extra days at sea.
The numbers tell the story. As of early 2026, Asia-to-Europe freight rates have stabilized at 25–35% above pre-crisis levels, after initial spikes of 40–60% when Houthi attacks on Red Sea shipping began in late 2023. The rerouting adds $200–$400 per twenty-foot container (TEU) in fuel, crew, and operational costs alone. War-risk insurance premiums remain elevated at $150,000–$300,000 per voyage. The estimated annual hit to global trade: $15–$20 billion.
Every one of those costs gets passed on to you, the consumer. More time at sea means more fuel burned, higher labor costs, and bigger insurance bills — and the invoice arrives in the price of everything from electronics to fresh produce.
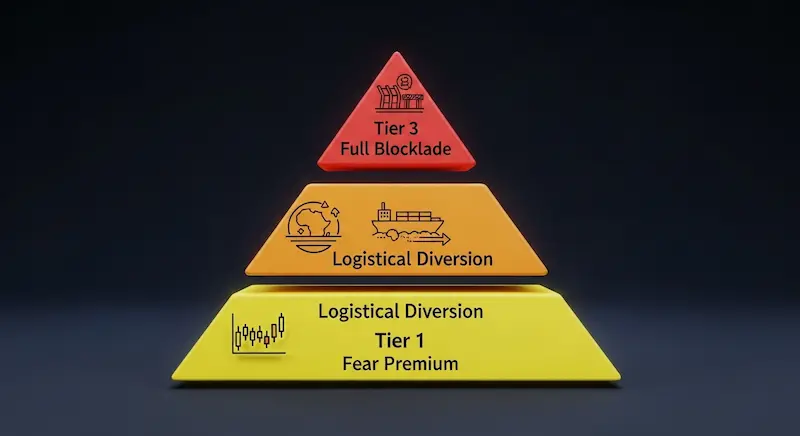
The Three Tiers of Geopolitical Market Impact
To make sense of the current crisis, it helps to categorize the potential impact based on how severely the world’s maritime chokepoints get disrupted. Think of it as a three-tier escalation ladder.
Tier 1: The “Fear Premium” — No Blockade, But Markets Price in “What If”
At this stage, no physical blockade is in place, but the threat of one exists. Markets respond to the uncertainty itself.
Oil sees a “war premium” of roughly $4 to $10 per barrel — the extra amount added to the price purely because of the risk of supply disruption, not because of an actual shortage. In the February Reuters survey, analysts estimated that this geopolitical premium was already baked into current prices. Investors shift to “safe haven” assets like gold and the U.S. dollar, while defense and energy stocks attract speculative inflows.
Tier 2: Logistical Diversion — The Red Sea Model (Ongoing Since Late 2023)
When specific routes become too dangerous, the global shipping network reroutes around the chokepoint entirely. This has been the reality for Asia-Europe trade since Houthi attacks escalated in late 2023.
Container traffic through the Suez Canal plummeted by 90% compared to March 2023, according to maritime analytics from Sino Shipping. The result is what economists call “sticky” inflation: even when oil prices stabilize, the cost of moving goods remains elevated because of the longer route. Maersk, for example, announced on March 1, 2026, that it would reroute additional Middle East services via the Cape of Good Hope in response to the Iran escalation. Industry experts at ING estimate that the Cape detour currently absorbs around 6% of the global container fleet capacity.
Tier 3: Full Strait of Hormuz Closure — The “Black Swan”
This is the scenario that keeps energy analysts up at night. According to the U.S. Energy Information Administration, oil flows through the Strait of Hormuz averaged 20 million barrels per day in 2024 — equivalent to about 20% of global petroleum consumption and more than a quarter of all seaborne oil trade. Kpler data for 2025 puts the crude-only figure at roughly 13 to 14 million barrels per day, or about 31% of global seaborne crude exports.
If the strait were fully closed, the consequences would be severe. Barclays analysts told clients that Brent could hit $100 per barrel in this scenario; UBS said a material disruption could send it above $120. Bob McNally of Rapidan Energy Group described a prolonged Hormuz closure as “a guaranteed global recession” and warned it could be “three times the severity of the Arab oil embargo.”
The alternatives are woefully insufficient. Saudi Arabia and the UAE operate bypass pipelines that can redirect a combined 3.5 million barrels per day around the strait — but that’s roughly one-third of current Gulf export flows. Iraq, Kuwait, and Qatar have no comparable alternative routes. That leaves approximately 14 million barrels per day structurally dependent on this single maritime corridor.
The destination markets matter too. About 84% of the crude oil moving through Hormuz in 2024 went to Asia. China, India, Japan, and South Korea are the top recipients. China alone receives half of its crude imports through the strait. As McNally put it, a closure would trigger “the mother of all bidding wars” as Asian buyers scramble for substitute supplies.
Strategic Alternatives: How the World Is Hedging Against Chokepoint Risk
Nations and corporations aren’t sitting still. Here’s how different alternatives stack up against the risk of Middle East disruption.
Logistics and Energy Route Alternatives
Suez Canal Route — The fastest path between Asia and Europe, but highly vulnerable. Most major carriers have avoided it since late 2023 due to ongoing security threats. Risk mitigation: Low.
Cape of Good Hope — Currently the de facto standard for Asia-Europe container traffic. Safe, but adds 14 days and increases fuel consumption by 30–40%. The industry has largely restructured around this route, with alliance loops, bunkering strategies, and transshipment patterns redesigned for Cape routing.
East-West Pipelines — Saudi Aramco’s East-West pipeline has 5 million b/d design capacity (about 3.3 million b/d spare), and the UAE’s Habshan-Fujairah pipeline adds 1.5 million b/d. Together they can bypass Hormuz, but their combined effective spare capacity of around 3.5 million b/d falls well short of the 14 million b/d structurally tied to the strait.
Strategic Petroleum Reserves — The U.S. SPR currently holds about 415 million barrels, according to the Department of Energy. Releases can dampen price spikes in the short term, but as ClearView Energy Partners noted, “in supply crises, duration matters. Scale does, too.” A full Hormuz crisis could outstrip what strategic stocks can offset.
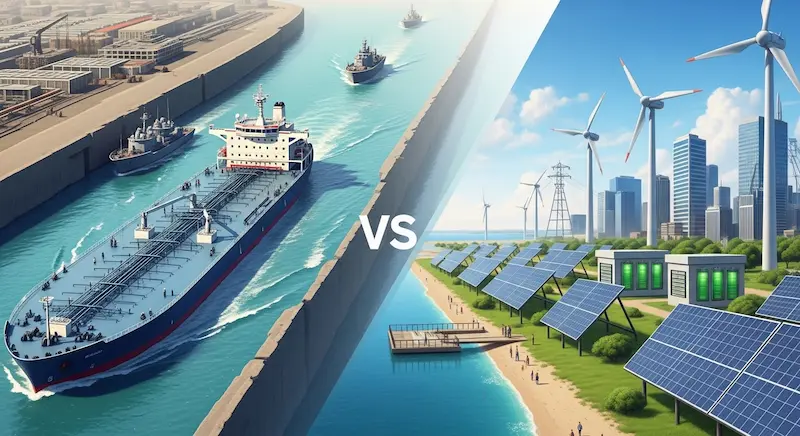
Long-Term Energy Transition Options
Fossil Fuel Expansion provides immediate supply relief but carries environmental costs and addresses a finite resource. For 2026 energy security, it remains essential — OPEC+ announced a production increase of 206,000 barrels per day for April, above expectations, partly as a response to the crisis.
Renewable Energy Transition offers the ultimate hedge against Middle East dependency — energy independence. But the high initial capital expenditure and intermittency issues mean this is a long-term solution with a slow return on investment.
Nuclear Power delivers constant base-load generation with the highest energy density of any source. It’s the “gold standard” for true energy independence, but regulatory timelines of 10+ years make it irrelevant for near-term crises.
Battery Energy Storage Systems (BESS) stabilize local grids and are becoming critical for data centers and edge computing. The dependency on raw materials like lithium and cobalt introduces its own supply chain risks, however.
Frequently Asked Questions
Why is the Strait of Hormuz so important for oil?
It’s the world’s most critical oil chokepoint. The EIA reported that oil flows through the strait averaged 20 million barrels per day in 2024 — about 20% of global petroleum consumption and more than a quarter of all seaborne oil trade. The problem is that very few land-based pipelines can handle this volume. Even if Saudi Arabia and the UAE fully utilized their bypass infrastructure, roughly two-thirds of current Gulf exports would still have no alternative route.
How does Middle East conflict affect my stock portfolio?
It generally creates a “risk-off” environment. High-growth tech stocks tend to dip as rising interest rate fears weigh on valuations, while the defense, energy, and commodities sectors usually outperform. They benefit from higher commodity prices and increased government spending. That said, market responses to geopolitical events tend to be sharp but sometimes short-lived — the duration and scope of the conflict matter enormously.
Will gas prices stay high forever?
Prices are heavily influenced by the “fear premium.” Once a clear de-escalation or diplomatic ceasefire is reached, that premium typically fades relatively quickly. However, the underlying Invisible Tax from rerouted shipping and elevated insurance costs can keep prices above pre-crisis levels for months. Bloomberg Opinion columnist Javier Blas noted that even with Brent at $80+, the macro picture doesn’t necessarily resemble a historic oil shock — though everything depends on how Tehran responds in the coming days.
What exactly is the “war premium” in oil pricing?
It’s the extra amount — typically $4 to $20 per barrel — added to the price of oil purely because of the risk of supply disruption, rather than an actual shortage. Before this weekend’s strikes, analysts in the February Reuters survey estimated the geopolitical premium already embedded in oil prices at $4 to $10 per barrel. That figure could increase significantly depending on the trajectory of the conflict.
How can I protect my savings from geopolitical inflation?
Investors commonly look toward “inflation hedges,” which historically include physical assets like gold, Treasury Inflation-Protected Securities (TIPS), and diversified exposure to the energy sector. However, this is general information — not financial advice. Every person’s financial situation is different, and specific investment decisions should be made in consultation with a qualified financial advisor.
Your Verification Checklist: Before You Make Any Financial Move
Before taking financial or strategic action based on Middle East headlines, run through these five checks.
Check the source. Is the news from a verified agency — Reuters, Bloomberg, AP, or major outlets like CNBC — or is it from the social media rumor mill? In fast-moving geopolitical situations, misinformation spreads rapidly.
Verify the chokepoint status. Has the Strait of Hormuz or Suez Canal actually experienced a physical stoppage, or just a warning or alert? As of March 2, tanker traffic through Hormuz has dropped sharply and Iran’s Revolutionary Guard has issued closure warnings, but the situation remains fluid.
Check EIA and IEA reports. The International Energy Agency’s monthly Oil Market Report provides data on global inventory levels, including OECD commercial stocks. High inventories can buffer price spikes. The IEA’s February 2026 report estimated global oil demand above 103 million barrels per day.
Monitor Fed communications. Listen for speeches from Fed officials and watch for FOMC minutes that cite “geopolitical energy costs” as a factor in interest rate decisions. The January 2026 FOMC minutes showed a majority of participants judging persistent inflation risk to outweigh employment concerns.
Watch insurance premiums. “War risk” surcharges from maritime insurers like Lloyd’s of London are the leading indicator of actual shipping disruptions. After the February 28 strikes, insurance premiums for Strait of Hormuz transit reportedly rose from 0.125% to 0.2–0.4% of ship value per transit — a significant jump that translates to hundreds of thousands of dollars per voyage for large crude carriers.
The Bottom Line: Geopolitical Risk Is No Longer a “Tail Risk” — It’s a Constant
As we navigate 2026, the era of cheap energy and open borders has given way to what can only be described as a Security-First Economy. Major investment banks — Goldman Sachs, Morgan Stanley, J.P. Morgan — are increasingly focused on “reshoring” and “friend-shoring,” the strategic relocation of supply chains away from geopolitical chokepoints.
The takeaway is clear. Geopolitical risk is no longer a remote, unlikely “tail risk” that shows up once a decade. It is a constant variable that must be factored into every financial decision, from personal investment allocations to corporate supply chain strategies.
The goal isn’t to predict the next missile strike. It’s to build a financial life that is resilient to the Invisible Tax that each crisis creates. When the world panics, the financial system systematically transfers wealth from those who react emotionally to those who understand the mechanics of the fear premium.
In a world where fear is the most expensive commodity, your greatest asset is clarity.

Sources
- U.S. Energy Information Administration (EIA) — Strait of Hormuz oil flow analysis, June 2025: https://www.eia.gov/todayinenergy/detail.php?id=65504
- International Energy Agency (IEA) — Strait of Hormuz Factsheet: https://iea.blob.core.windows.net/assets/203eb8eb-2147-4c99-af07-2d3804b8db3f/StraitofHormuzFactsheet.pdf
- U.S. Bureau of Labor Statistics — Consumer Price Index, January 2026: https://www.bls.gov/news.release/pdf/cpi.pdf
- Federal Reserve — FOMC Minutes, January 27–28, 2026: https://www.federalreserve.gov/monetarypolicy/fomcminutes20260128.htm
- CNBC — U.S. crude oil jumps more than 8% on Iran supply fears, March 1, 2026: https://www.cnbc.com/2026/03/01/crude-oil-futures-iran.html
- CNBC — Experts weigh potential scenarios for oil if Strait of Hormuz closes, March 1, 2026: https://www.cnbc.com/2026/03/01/experts-weigh-potential-scenarios-for-oil-if-strait-of-hormuz-closes.html
- CNBC — How the attack on Iran could impact the global oil market and economy, February 28, 2026: https://www.cnbc.com/2026/02/28/iran-us-attack-oil-market-economy.html
- J.P. Morgan — Fed Leaves Rates Unchanged: Is a Cut Coming in March? January 2026: https://www.jpmorgan.com/insights/markets-and-economy/economy/fed-meeting-january-2026
- J.P. Morgan Global Research — Oil Price Forecast 2026: https://www.jpmorgan.com/insights/global-research/commodities/oil-prices
- Logistics Middle East — Measuring global supply chain reliance on Hormuz, February 27, 2026: https://www.logisticsmiddleeast.com/analysis/measuring-global-supply-chain-reliance-on-hormuz
- DocShipper — Red Sea Crisis Update: Route Alternatives & Cost Impacts, January 2026: https://docshipper.com/shipping/red-sea-crisis-update-route-alternatives-cost-impacts/
- ING Think — A Red Sea return would be a game changer for container shipping in 2026, December 2025: https://think.ing.com/articles/returning-to-the-red-sea-a-key-event-to-watch-in-container-shipping-for-2026/
- RBC Economics — Deep Dive: How to Monitor US Inflation in 2026, February 2026: https://www.rbc.com/en/economics/us-analysis/us-featured-analysis/deep-dive-how-to-monitor-us-inflation-in-2026/
- gCaptain — Tankers Diverting Strait of Hormuz as U.S./Israel Strikes Intensify, March 1, 2026: https://gcaptain.com/tankers-diverting-strait-of-hormuz-region-as-u-s-israel-strikes-on-iran-intensify/
Disclaimer: This article is for informational purposes only and does not constitute financial advice or a recommendation to buy or sell any investment product. All investment decisions should be made in consultation with a qualified financial advisor. Data is current as of March 2, 2026.